February 2012
 |
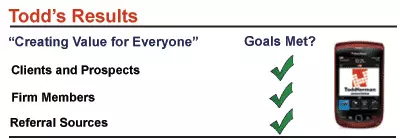
| Learn the purpose behind the chart and the Blackberry. |
Ah-Ha! Moment – At our Firm Meeting in mid-February, I shared with the firm members the LARGE number of potential projects and prospects we had in our pipeline. I went on to say, "In fact, this is the best I've EVER seen our pipeline, only 6 weeks into the new year!"
At the meeting, I attributed this to an improving local economy, buoyed by a strengthening national economy. Even though the Great Recession "officially" ended in June 2009, it's only now finally beginning to "feel" like an economic recovery – and with a recovery comes a lot of pent up demand. Companies have hunkered down for 3-4 years, and have not made investments to improve their business results. So, I initially chalked up our healthy pipeline to an improving economy.
As I reviewed metrics on our business development activities between 2010 and 2011, I was shocked at how much MORE we had gotten done in 2011 versus the prior year. Calls, emails, meetings, networking events, projects, and new clients – all were up from 2010 levels, and most were up significantly. So, the metrics show much greater hustle in 2011, which appeared to payoff in 2012 via the pipeline.
How did we get a healthy pipeline? Like so many other things, it's not an "either-or" proposition – it's really a "both-and" proposition. Both the improving economy and our collective hustle contributed to our pipeline.
The lesson learned? I can't control the economy, so I'll control what I can, which is the quantity of certain activities. Like the farmer sowing seeds, I did not know what or when the harvest would be. Yet, sowing good seed and nurturing relationships for the long-term is the essence of sustainable Business Development!


