

For background on this particular project, please visit 3 Vital Questions Your Business Reports Must Answer.
Situation: Magazine Article Sparks Idea
Our client's Chief Information Officer (CIO) – let's call him "Mark" – read a Wired magazine article on how electronic medical records (EMR) could enable better presentation of technical information, benefitting both the doctor and the patient. Mark's vision – make the patient the center of lab reporting, while also giving individual doctors their own reporting preferences.
Opportunity: CIO Identifies Innovation Opportunity
Mark "connected the dots" between the article and his company's key deliverable – a lab result document. He sensed an innovation opportunity – a way to distinguish his company from its competitors – and got other top executives on board.
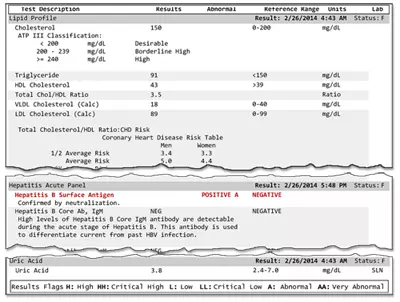
BEFORE: First Page of Typical Report
- Little formatting – only red text for values outside reference range
- Reference sources placed in-line with test results, making the overall report “choppy to read
- Primary Reader – Physician
- Purpose – Presenting technical information
Solution: Reports That Truly Communicate
We worked with Mark to design and develop a prototype, generating much excitement inside the company – in particular, sales representatives recognized this major point of differentiation compared to competitors' offerings.
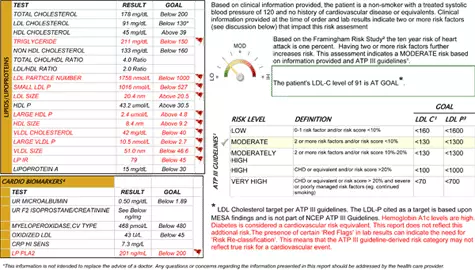
AFTER: First Page of Revised Report
- Uses color, formatting, symbols , and visualizations
- Reference sources placed at end of report, making overall report “flow” better for the patient
- Primary Readers – Patient and Physician
- Purpose – Communicating results and overall assessment, and presenting technical information
The project was quickly upgraded from "proof of concept" to a formal project, with the following key goals:
- Communicate clearly and in non-technical language, yet still presenting lab results with all the required reference ranges – which reflected age, gender, and other factors – and legally-required caveats.
- Present the results accurately and visually, without attempting to interpret the results or to make a diagnosis – these are the doctor's responsibilities.
- Enable easy, yet secure, access to the new reports. When possible, a PDF is stored directly in the doctor's lab order entry system – in other cases, the doctor received a link to download the report from a secure web portal.
To help meet these goals, our client engaged a cardiologist as the project's subject matter expert (SME). We worked closely with him to achieve his ideal report.
Realizing other doctors might want their own customizations, we designed and developed the application to allow quick and easy report creation and customization, even down to a specific doctor's preferred font and point size.
Results & Benefits: Three Innovative Report Types
All the project goals laid out were met – and then some. While one deliverable had been expected, three were actually produced.
The first deliverable was the report for the cardiologist, reporting lab results for several tests commonly ordered by cardiologists and thus was a frequent, but unique report. Reporting and presenting results was completely redesigned, as shown in the "Before" and "After" illustrations.
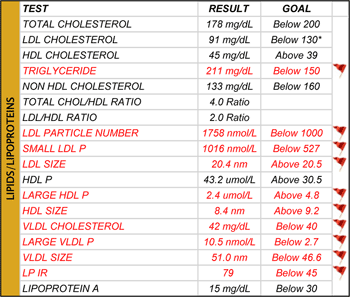
AFTER: Lipids and Lipoproteins
- Excerpt from cardiologist’s report
- Uses both colors (red) and symbols (red flag) to highlight problem areas.
The second deliverable, a general lab results report, was a by-product of the more complex first deliverable. Drawing on the library of visualizations we created for the first report, this report provided a cleaner and more visual presentation of basic results.
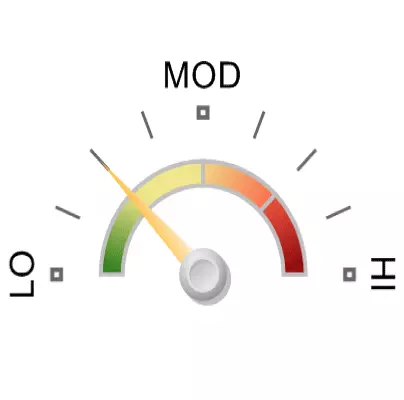
AFTER: Overall Cardiovascular Disease Risk Level
- Excerpt from cardiologist’s report
- Uses “gauge” to present overall risk assessment.
- Patients now immediately understand their overall results – the familiar temperature gauge needs no explanation
The third deliverable, customized reporting, was a system accommodating an individual doctor's preferences – for example, when a doctor with low vision requested a larger font size for his report, this was quickly developed and deployed.
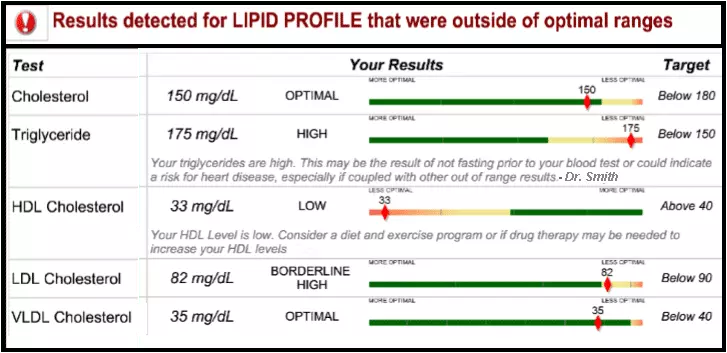
AFTER: Lipid Profile
- Excerpt from a Lipid Profile report
- Uses slider bars to visually present the scale of normal, borderline, and risky values
- Uses a red diamond to show patient’s results
- “More Optimal” and “Less Optimal” labels placed to indicate “Below” (lower is better) or “Above” (higher is better) interpretation
All these outcomes improved the satisfaction of existing customers, and allowed our client to obtain many new customers specifically because of this project's success.
Winning New Business With Report Clarity
Mark's vision was to win new business by being the first lab in its market to offer patient-centered and doctor-specified results. Sales representatives capitalized on this new capability, and Mark's vision is now a reality.
Would you like to enjoy benefits like our client did? If so, contact me now about your business reporting ideas and questions.
Call Todd: 336.297.4200