

July 1995
Situation ...
A designer and manufacturer of sportswear apparel faced a familiar problem – it was losing market share to its competitors, resulting in operating performances below company expectations and projections.
Problem ...
This company needed information on what its competitors were doing and how they stacked up against them. The problem was how to summarize vast amounts of data that would be useful to management in making strategic decisions.
Solution ...
A competitive financial analysis model comparing financial information of the sportswear company against key competitors' data, focusing on profitability and asset use measures. Financial information was obtained from a variety of publicly available sources. Key comparisons in the financial model included:
- Earnings Ratios
- Profitability Ratios
- Return on Invested Capital (ROIC) and Economic Value Added (EVA)
- Efficiency Ratios for Accounts Receivable, Inventory, and Accounts Payable
- Liquidity Measures
- Capital Structures
The number of computations and companies wanted by our client created its own problem – how to concisely compare our client versus other companies. We constructed formulas to symbolically display the relation of each company's results against the average for all the companies, highlighting key results visually using the following legend:
- << – Much lower (< 75%) than the average.
- < – Lower than the average.
- = – Equal to the average.
- > – Greater than the average.
- >> – Much greater (> 125%) than the average.
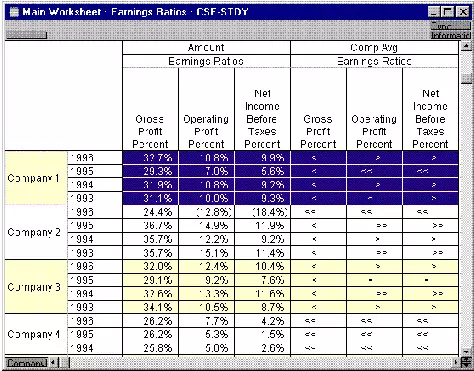
This financial model allowed all data to be entered in one view (as shown above), while computed results were displayed in other views (as shown below).
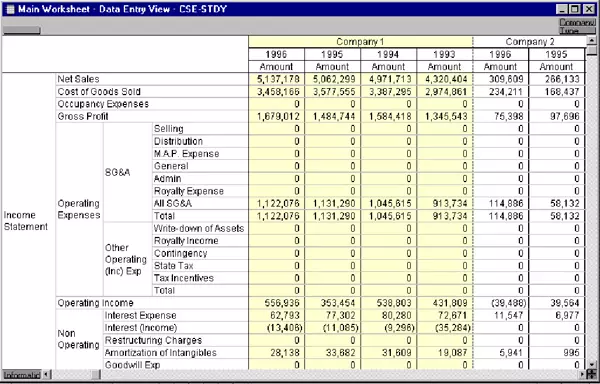
Relational spreadsheet software permits natural language general formulas (for example, Gross Profit = Net Sales - Cost of Goods Sold - Occupany Expenses) to ensure consistency across all companies and periods. General formulas were also used to calculate the average for each measure, to assess each company's relation to the average, and to symbolically display these relations.
Results & Benefits ...
The client uses this model to benchmark their financial performance against its key competitors. Having timely competitive knowledge has been useful in identifying management issues and planning the future financial and operational direction of the company.
Conclusion ...
Periodic updates are made to the model so that the client can determine progress in its performance initiatives. The financial analysis model has allowed our client to better analyze what their competitors are doing. The model has revealed which competitors have the best practices in areas such as outsourcing and inventory management. In addition, it has identified the emergence of new competitors, as well as documented reasons for changes in financial performances of existing competitors.