

For background on this particular project, please visit Business Analytics Gets Down to Business.
Situation...
The main business of a medical services company requires maximizing staff utilization. To support these staff-driven revenues, a large amount of inventory is required to be kept on hand.
Problem...
This company's planning and systems focused on planning service revenues and controlling payroll-related costs. As a result, little attention had been paid to the $1.2 million central inventory required to support the staff at many distributed locations. Management suspected that inventory levels could be reduced, without jeopardizing availability levels. There was, however, no single information source containing inventory quantities, usages, and costs.
Solution...
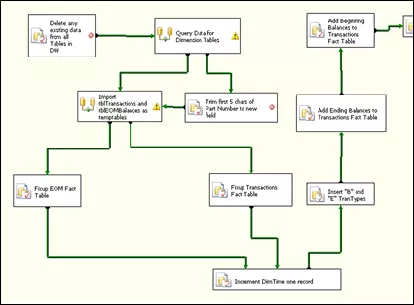
Our client requested that we consolidate the various inventory-related data sources, and then analyze the results for inventory reduction opportunities. Because this type of analysis had been done before, we knew the effort required for a one-time manual consolidation and analysis. Thus, we recommended that we automate the integration and analysis for a small incremental cost, yielding recurring benefits.
Software tools recently introduced permitted us to perform complex extract, transform, and load (ETL) operations at a much lower cost – for both software and services – than traditional dedicated ETL packages. Our knowledge of inventory analysis methods, database techniques and tools, and our client's business allowed us to quickly meet our client's needs.
 |
|
 |
|
Results and Benefits...
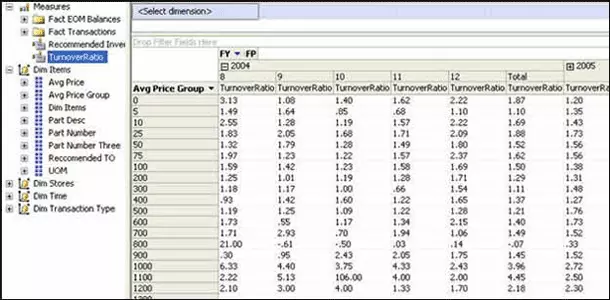
Applying basic inventory analysis screenings to the integrated information allowed us to recommend an inventory management policy that was easily understood and applied, based on the:
- Dollar value of the item.
- Estimated turn period of the item.
- Ordering, shipping, and handling costs.
As this recommended policy is adopted, the dollar value of the central inventory is expected to be reduced by at least 25%. High levels of product availability have been maintained. Also, the process of analyzing inventory turnover and consolidating and reporting information from multiple business systems is now automated and repeatable.
Conclusion..
Our client decided to automate the consolidation and analysis of a large inventory location, which paid for itself on the initial inventory reductions. Further analyses and reductions are now possible, because the information to do this is now routinely available.
For Further Information...
To discuss how similar integration and analysis techniques could be applied to a wide variety of issues facing your business, please call us at 336.297.4200 to schedule a no-obligation consultation.