

Situation ...
This real estate client had a large quantity of high-quality operational data in its business systems. These systems had been in use for many years, and major upgrades – such as from the DOS to the Windows versions of the systems – had been well-managed to fully convert and preserve historical information. Information from these systems were routinely compiled and analyzed for periodic reviews of each property.
Problem ...
Several business systems, addressing different aspects of this client's complex operations, were in use, and the reporting tools these systems provided were not sufficient to produce many of the complex trend and other analyses routinely used to review their properties. Calculating these analyses in electronic spreadsheets was both time-consuming and error-prone.
Solution ...
To help executives and managers in these periodic property reviews, as well as in day-to-day decisions, an executive dashboard was developed to concisely and visually present key metrics in the various business areas, including:
- Properties
- Tenants
- Suites
- Leases
Performance of the dashboard was optimized by storing pre-aggregated results in the underlying Online Analytical Processing (OLAP) cube, and by optimized data structures in the related data warehouse. The dashboard then draws information from the OLAP cube and data warehouse for calculations and presentations.
Should an executive or manager desire more information about a metric of interest, extensive drill-down and drill-around capabilities were developed to more fully tap the rich treasure trove of information stored in the data warehouse and OLAP cube.
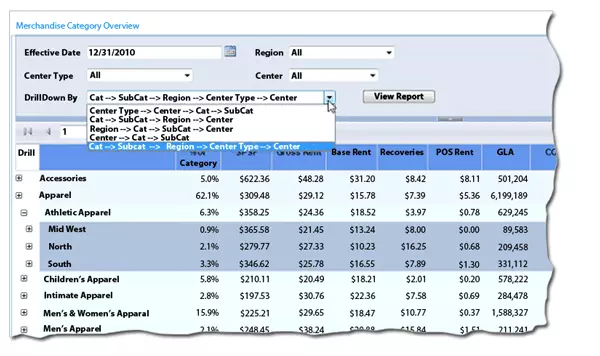
Below, this major report demonstrates the flexibility provided users. Date, Center Type (Drive By, Destination, Local), Region, and Center can all be specified. Since the overall report is on merchandise category, the user can also select how the drill-down outline is organized through the "Drill Down By" picklist. This screen shows the Category -> Sub-Category -> Region progression.
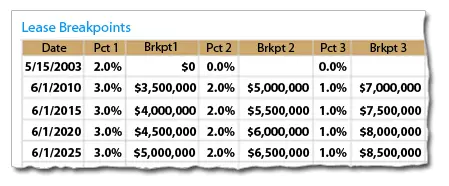
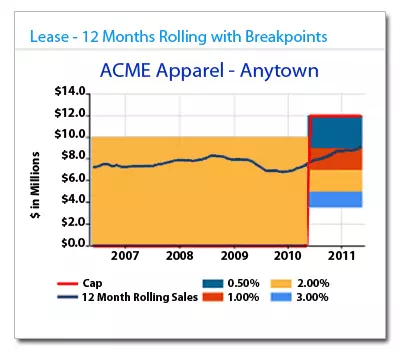
These two boxes, below, show exactly the same information. The first table below accurately presents data, but does little to add meaning. The second chart below quickly shows a major lease change in 2011.
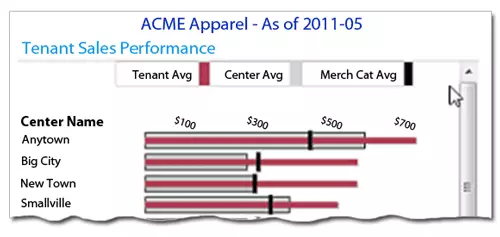
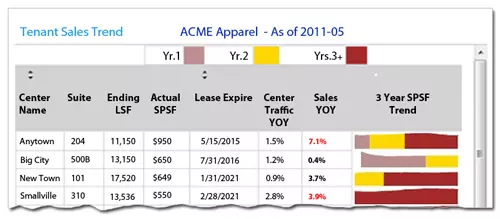
Of interest to both our client and their tenants is store performance by location, compared to averages for the property and the merchandise category – illustrated by the first chart, below. Similarly, a tenant's sales trend across all centers identifies how our client and their tenant might jointly help boost sales at a particular low-performing store – shown in the second image, below.
Results & Benefits ...
While the dashboard project was undertaken to benefit the executive group, many areas are benefitting:
- Executives and managers now have ready access to information previously available only on an ad hoc basis through extensive queries and report writing.
- The Information Systems group now focuses less on the presentation of information and more on the quality of information in the underlying systems.
- The Leasing group is able to use the dashboard to answer substantive questions from and about tenants, enabling faster and better responses to lease opportunities.
The routines loading data into the data warehouse:
- Have also increased confidence in the underlying business systems, because they scrutinize data, marking erroneous data for correction and re-submission.
- Draw information directly from the business systems, virtually eliminating maintenance of the data warehouse. As new properties are added, the loading routines recognize this and automatically populate the required data warehouse tables.
Conclusion ...
The design, development, and deployment of an executive dashboard was the culmination of a large data warehouse and OLAP cube project, giving persons in many areas of the business meaningful information never readily available before.
For More Information ...
To discuss how technology usage and business process improvements could be applied to the issues facing your business, call us at 336.297.4200 to schedule a no-obligation consultation, or click here to contact us online.
Read about more benefits of an Executive Dashboard and Data Warehouse.