

You want your company to be data literate, yet how comfortable are you with your data integrity?

“Data literacy” is currently a buzzphrase, so it can mean different things to different people. To help bring some consistency to this topic, let’s first discuss two other topics.
Data
Most companies have two main types of data – operational and financial. Operational data comes from the operations system used to manage the day-to-day workings of a business, such as a retailer buying and selling items. Financial data comes from the accounting system used to record the cost of purchased items and the revenue on items sold.
During my four-decade professional career serving over 200 clients in numerous industries, I have noted that few companies use both operational and financial data effectively. A primary reason for this? The company's executives perceive data from one or both source systems to be questionable.
For companies to be data literate, data sources first have to be trustworthy – that is, complete, correct, and consistent. We refer to trustworthy data as having “data integrity”.
Data Integrity
The Harvard Business School has a good blog post with this very clear and simple definition of data integrity:
Data integrity is the Accuracy, Completeness, and Quality of data as it’s maintained over time and across formats. Preserving the integrity of your company’s data is a constant process.
The only change I'd make to this definition is to replace Quality with Consistency – after all, if data is accurate and complete, as well as consistent over time, then that data inherently has high quality.
My firm has been working with a client that knew their financial data lacked integrity, so they engaged us to identify root causes of the questionable results. One problem we identified – employees not correctly coding time to service lines.
The timekeeping system required the employee to enter three codes – division, department, and project – to categorize their time. The problem? Employees did not know whether to code their OWN division and department, versus the division and department associated with the PROJECT they were working on. So, they made their best guesses.
As a result, managers did not know how much their department’s org chart and projects cost them, since their employees' time wasn’t recorded correctly.
What was needed to improve the accuracy of the time keeping? Revise the timekeeping system to automatically select the division and department of the EMPLOYEE, so the only thing the employee had to select was the PROJECT. This made things much easier for everyone – the employee, the payroll staff, and the accounting staff. After this change, a manager could know both the cost of her own org chart, and of her department’s projects that frequently required skills from other departments.
We also helped simplify how revenues and operating expenses were recorded. The most important change was to recognize that a project belonged to one, and only one, combination of division and department. Accounting staff only has to determine the correct project, which then dictates the correct division and department.
With these changes now in place for nearly a year, our client's financial data finally has good Accuracy, Completeness, and Consistency – in other words, the data has good integrity.
Data Literacy
Tableau, a company focused on data visualization tools, defines data literacy this way:
So what is data literacy? The definition is: the ability to explore, understand, and communicate with data in a meaningful way. This can be on different levels: technically and advanced, or on a much more basic level.
Sometimes, the best insights come from very high-level data. Consider this highly-summarized income statement for the first six months of two years:
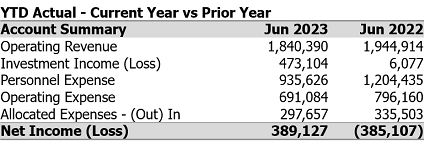
Do you see what I eventually saw in these numbers?
The strong stock market in 2023 drove strong investment results – and these strong results caused Investment Income for the first six months to be LARGER than Net Income. In 2022, the stock market was weaker, so the almost break-even investment results did not dramatically affect Net Income.
I decided to Explore Operating Income, which is Net Income excluding Investment Income:
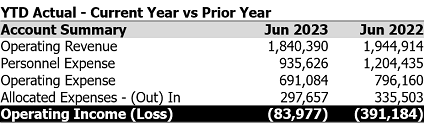
It's important to Understand the significance of Operating Income. The Executives overseeing the three divisions need to focus on what their VP's and staff CAN control, and market performance is beyond their control.
Of course, both Net Income and Operating Income are important to Communicate to the Executives and Boards, so the financials now present both sets of numbers:
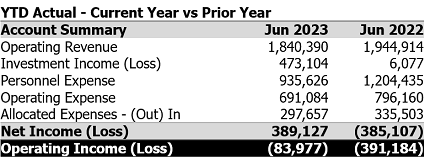
This client’s new focus on Operating Income (Loss) is causing them to look at more granular financial data – which now has good data integrity – to determine what departments and projects operated profitably … or not.
We are now starting to assess the integrity of this client's operating data. Doing so is a prerequisite to delivering what their Board has wanted for several years – dashboards that can be used by the Board and company Executives and VP's, showing trends in both key operational success factors, and trends in aggregate and service-line financial results.
First Things First
IBM has a good introductory video on Data Literacy – here's a screen grab from its closing section:
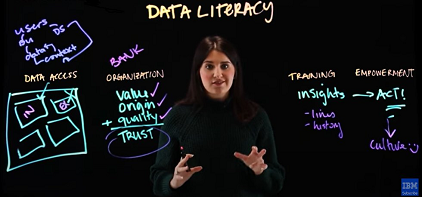
While this video focuses on four key elements of data literacy, a major prerequisite is the last item under the Organization element – Trust. Without data that can be trusted – that is, possessing data integrity – data literacy is impossible.
Are you 100% sure both your operational and financial data can be trusted? If not, let's talk about your data's integrity – and if so, let's discuss your company's data literacy.
Check out our latest video on Data Literacy!
Sincerely,

Todd L. Herman